セットアップ
Chart.jst公式URL
データ分析分野に関連して統計データの表示が簡単に実装できるグラフを簡単に表示
インストールURL
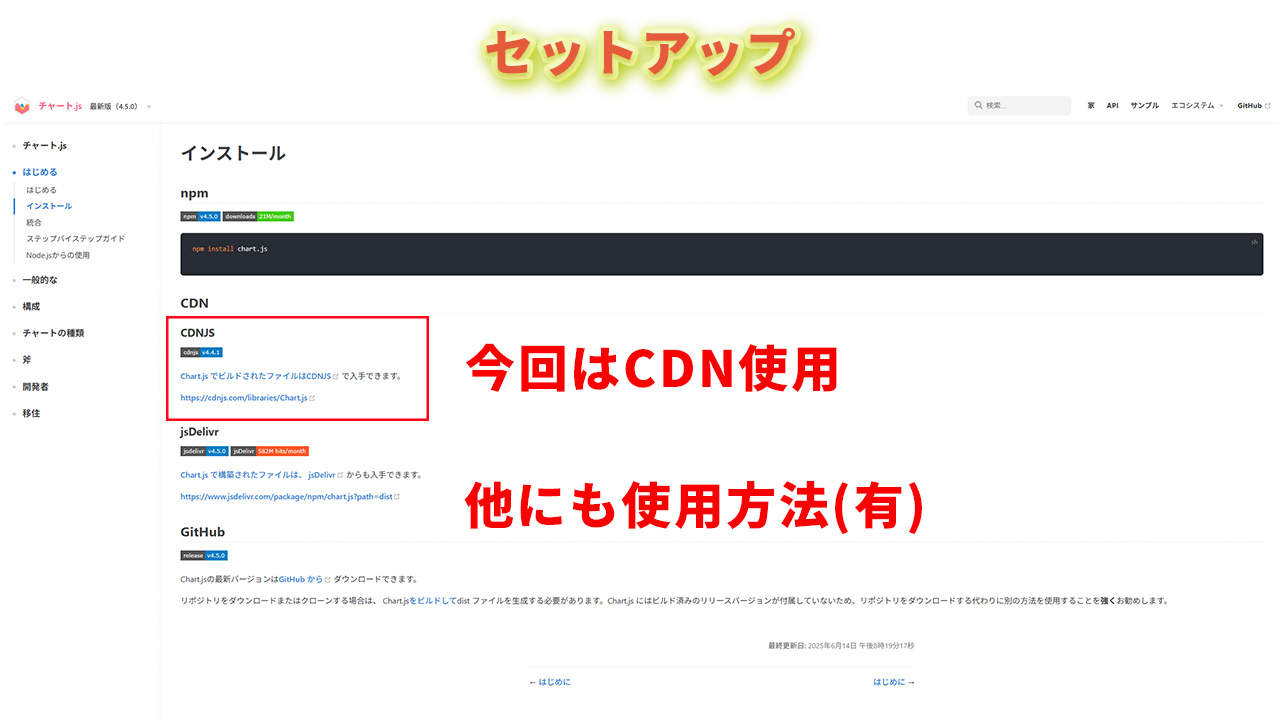
  CDNを使用する場合
  <script src="https://cdnjs.cloudflare.com/ajax/libs/Chart.js/4.4.1/chart.umd.min.js""></script>
使用例-1
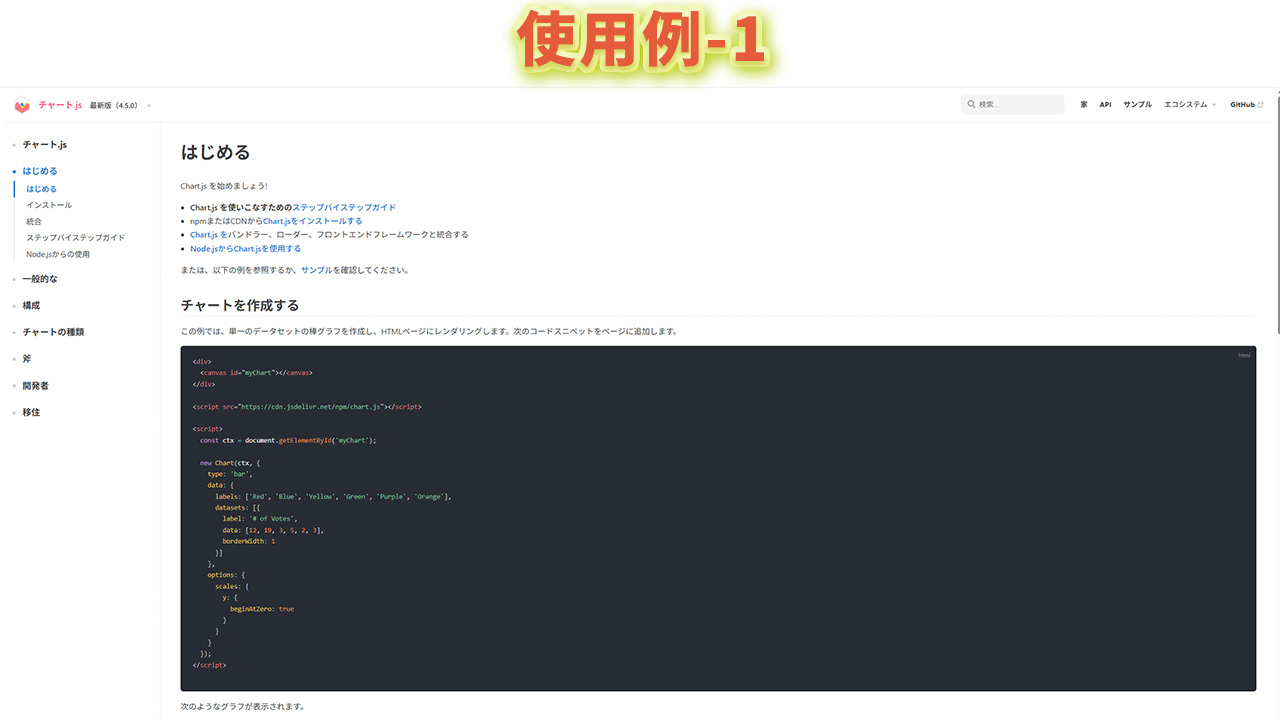
  HTML
  キャンバスを作成する
  <canvas id="myChart"></canvas>

  JavaScript
  const ctx1 = document.getElementById('myChart');

  new Chart(ctx1, {
  type: 'bar',
  data: {
    labels: ['2020', '2021', '2022', '2023', '2024', '2025'],
    datasets: [{
      label: '# of Votes',
      data: [12, 19, 3, 5, 2, 20],
      backgroundColor: 'rgba(54, 162, 235, 0.2)',
      borderColor: 'rgba(54, 162, 235, 1)',
      borderWidth: 1
    }]
  },
  options: {
    scales: {
      y: {
        beginAtZero: true
      }
    }
  }
  });
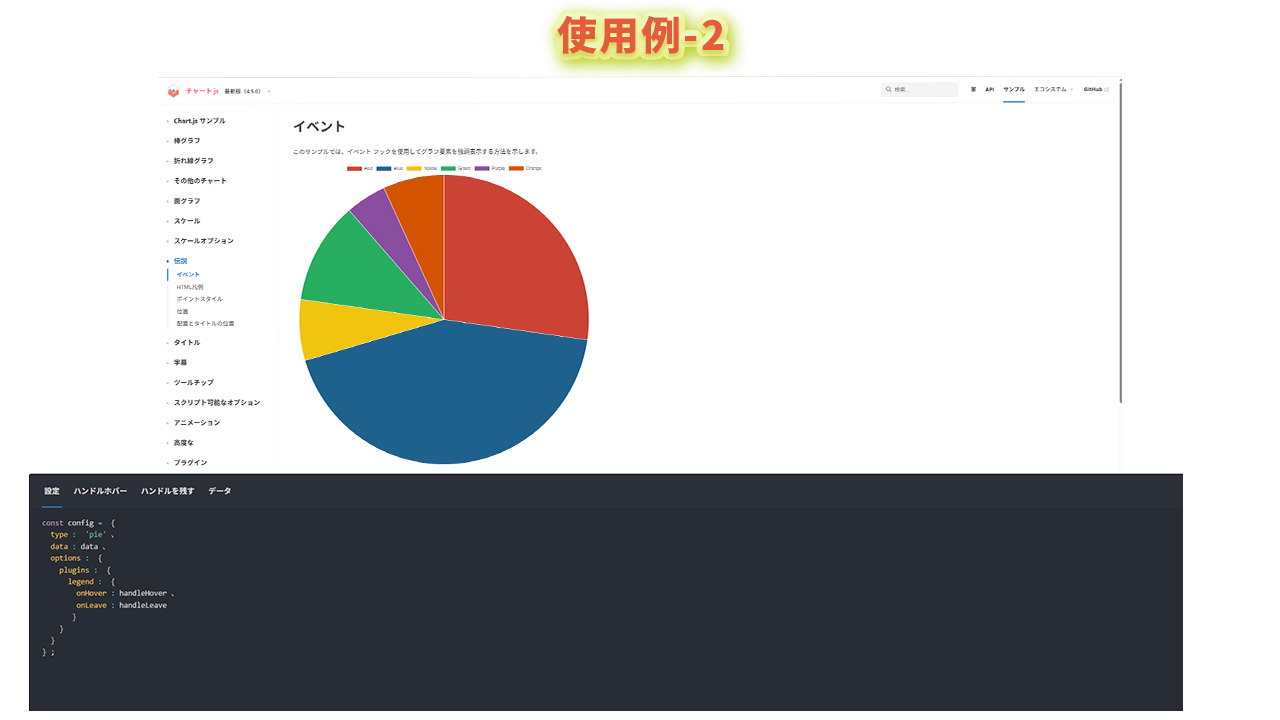
使用例-2
追加要素を入れないと上手に表示されない
Chart.jst円グラフURL
  HTML
  キャンバスを作成する
  <canvas id="rotundChart" width="400" height="400"></canvas>

  JavaScript
  // Chart.jsの設定,コピペ可能,追加部分を記入して表示される

  const data = {
  labels: ['赤', '青', '緑'], // セグメントのラベル
  datasets: [{
    label: 'サンプルデータ',
    data: [300, 50, 100], // 各セグメントのデータ
    backgroundColor: ['#FF0000', '#0000FF', '#00FF00'], // セグメントの色
    hoverOffset: 4
    }]
  };

  // イベント処理関数
  function handleHover(event, legendItem) {
  console.log('Hovered over: ', legendItem);
  }

  function handleLeave(event, legendItem) {
  console.log('Left: ', legendItem);
  }

  // Chart.jsの設定
  const config = {
  type: 'pie', // 円グラフ
  data: data,
  options: {
    plugins: {
      legend: {
        onHover: handleHover, // ホバーイベント
        onLeave: handleLeave  // 離れた時のイベント
      }
    }
  },
  plugins: [{
    id: 'textOnSegments',
    afterDatasetsDraw: function(chart) {
      const ctx = chart.ctx;
      const meta = chart.getDatasetMeta(0);

      meta.data.forEach((element, index) => {
        // セグメントの中心位置を計算
        const { x, y } = element.tooltipPosition();

        // セグメントの色に応じてテキストの色を設定
        let textColors = [];
        if (index === 0) { // 赤いセグメント
          textColors = ['white', 'black']; // 白と黒で見やすく
        } else if (index === 1) { // 青いセグメント
          textColors = ['white', 'yellow']; // 白と黄色で見やすく
        } else if (index === 2) { // 緑のセグメント
          textColors = ['white', 'black']; // 白と黒で見やすく
        }

        // テキストを描画
        ctx.save(); // 現在の状態を保存
        ctx.font = 'bold 32px Arial'; // フォントサイズを大きく
        ctx.textAlign = 'center';
        ctx.textBaseline = 'middle';

        // 影を追加して見やすく
        ctx.shadowColor = 'rgba(0, 0, 0, 0.5)';
        ctx.shadowBlur = 2;
        ctx.shadowOffsetX = 1;
        ctx.shadowOffsetY = 1;

        // 1つ目のテキスト(ラベル)
        ctx.fillStyle = textColors[0];
        ctx.fillText(chart.data.labels[index], x, y - 12);

        // 2つ目のテキスト(数値)
        ctx.fillStyle = textColors[1];
        ctx.fillText(chart.data.datasets[0].data[index], x, y + 12);

        ctx.restore(); // 状態を復元
      });
    }
  }]
  };

// グラフを描画
const ctx2 = document.getElementById('rotundChart').getContext('2d');
new Chart(ctx2, config);