Chartist.js

Chartist.jss公式URL
グラフ制作用のライブラリ,様々な種類のグラフが簡単に使用可能
CSSが変更しても反映されない場合は、読み込むCSSの順番を変更してみよう
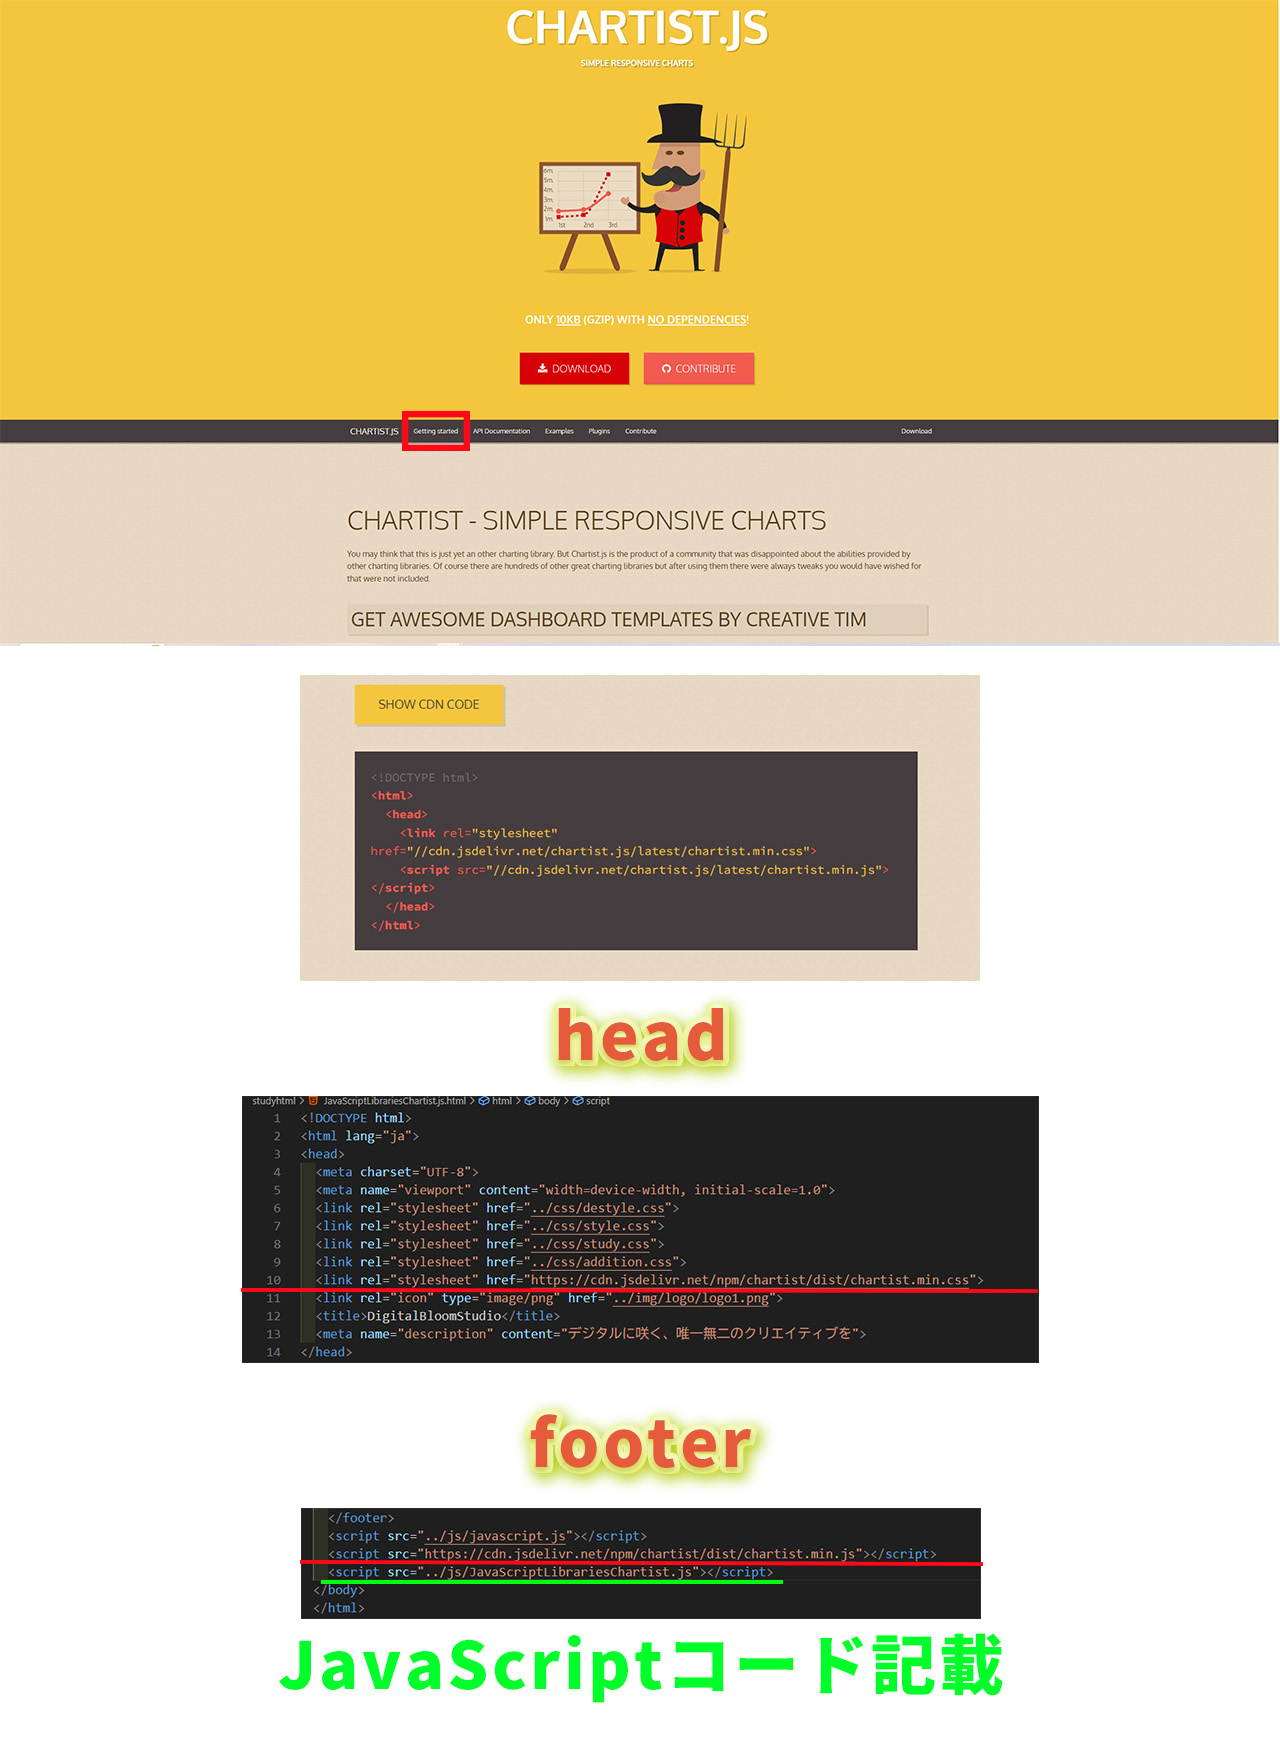
セットアップ
  CDNを使用する場合
  <link rel="stylesheet" href="https://cdn.jsdelivr.net/npm/chartist/dist/chartist.min.css">
  <script src="https://cdn.jsdelivr.net/npm/chartist/dist/chartist.min.js"></script>
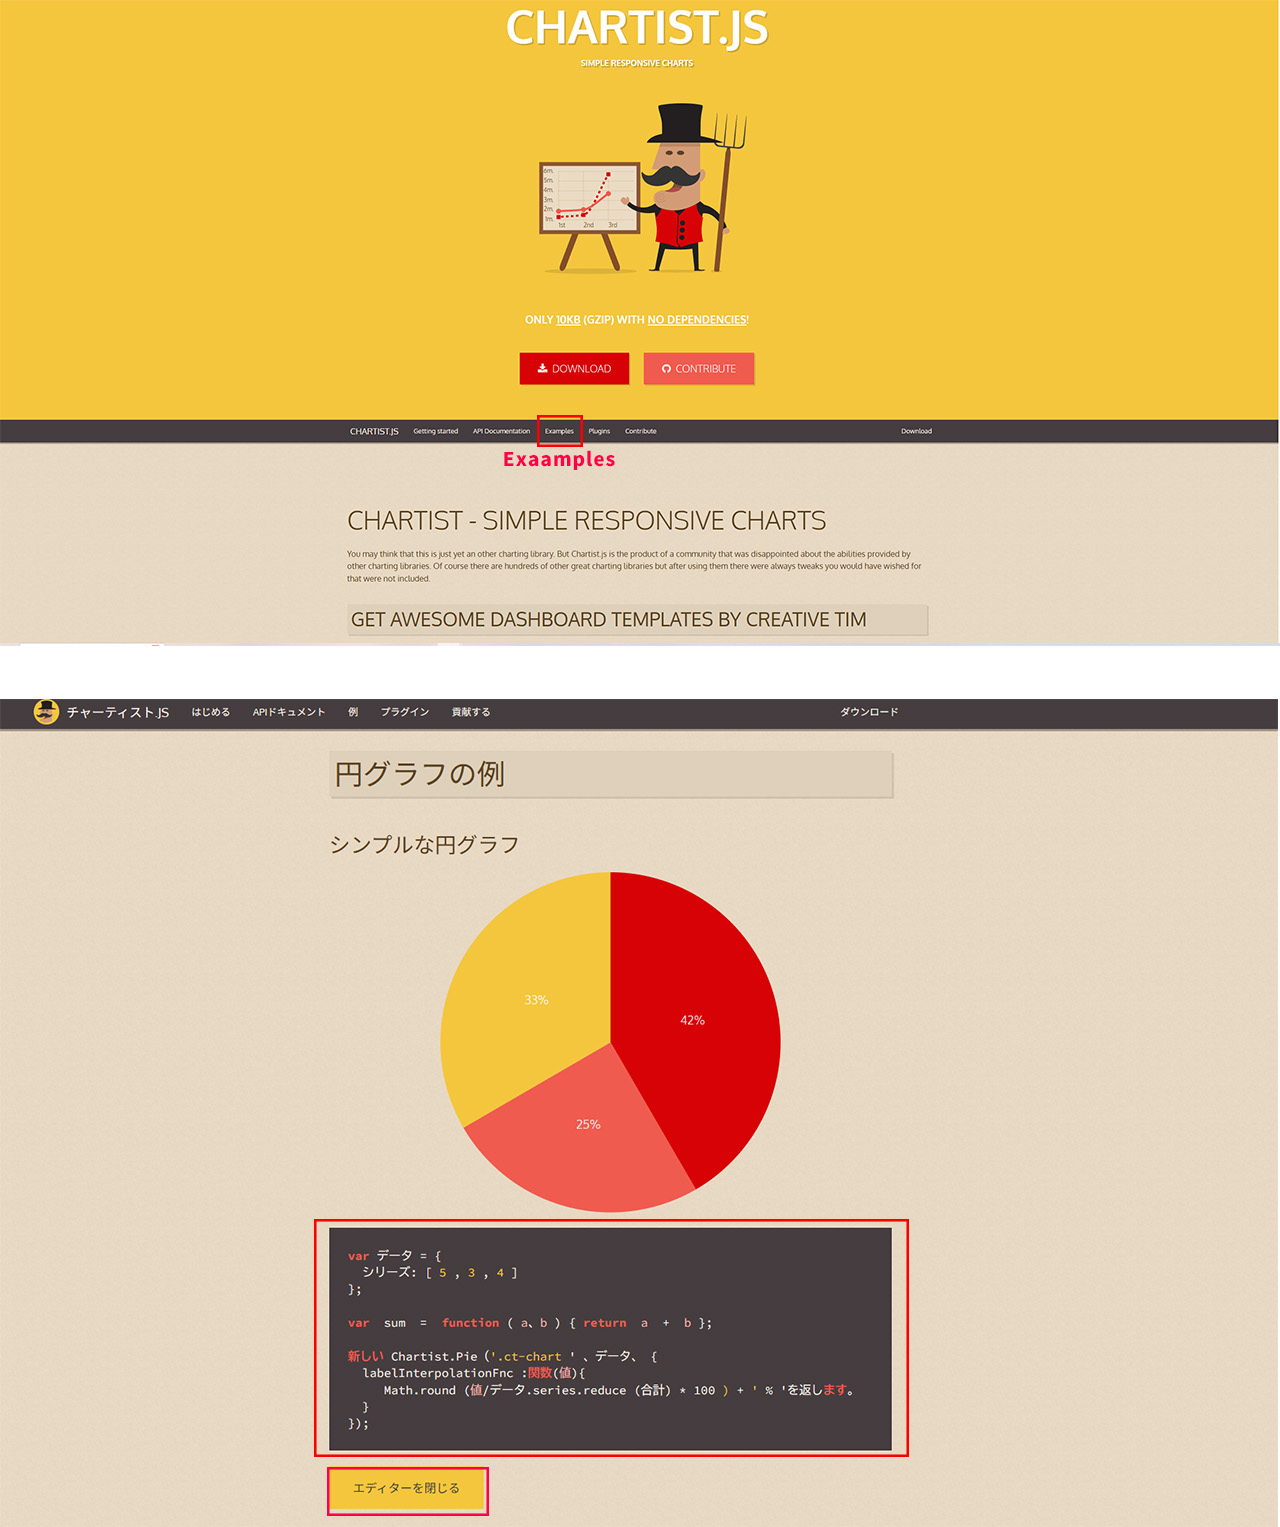
円グラフ
    HTML
    <div class="chart-round"></div>

    JavaScript
    var data = {
    series: [5, 3, 4]
    };
    var sum = function(a, b) { return a + b };
    new Chartist.Pie('.chart-round', data, {
      labelInterpolationFnc: function(value) {
        return Math.round(value / data.series.reduce(sum) * 100) + '%';
      }
    });

    CSS
    /* Chartist.js シンプルな円グラフ */
    .chart-round {
      width: 100%; /* 幅を100%に設定 */
      height: 400px; /* 高さを400pxに設定 */
      margin: 0 auto; /* 中央寄せ */
    }
    /* 円グラフ専用のラベル */
    .ct-chart-pie .ct-label {
      font-size: 24px;
      fill: #fff;
      text-shadow: 1px 1px 2px rgba(0,0,0,0.5);
    }
円グラフ応用
  HTML
  <div class="custom-round"></div>

  JavaScript
  Chartist.js 円グラフ応用  グラフの項目とデータ(円グラフの場合)
  var pieData = {
    labels: ['A','B','C','D','E'],
    series: [36,27,16,13,8]
  };
  表示オプション(グラフの高さや幅)
  var pieOptions = {
    width: '100%',
    height: '500px'
  };
  グラフの種類と表示させる場所  custom-roundのクラス名の要素に、pieDataとpieOptionsの内容で作成する
  new Chartist.Pie('.custom-round',pieData,pieOptions)

  CSS
  テキストの変更
  .ct-chart-pie .ct-label {
    font-size: 24px;
    fill: #fff;
    text-shadow: 1px 1px 2px rgba(0,0,0,0.5);
  }
  (D E)背景色変更
  .ct-series-d .ct-slice-pie {
    fill: black;
  }
  .ct-series-e .ct-slice-pie {
    fill: green;
  }
円グラフ応用アニメーション
  HTML
  <div class="custom-round-anim"></div>

  JavaScript
  var pieData = {
  labels: ['AAA','BBB','CCC','DDD','EEE'],
  series: [36,27,16,13,8]
  };
  //表示オプション(グラフの高さや幅)
  var pieOptions = {
    width: '100%',
    height: '500px'
  };
  //グラフの種類と表示させる場所
  //p-pieChartのクラス名の要素に、pieDataとpieOptionsの内容で作成する
  var chart = new Chartist.Pie('.custom-round-anim',pieData,pieOptions);

  // アニメーションを追加(円グラフ用)
  chart.on('draw', function (data) {
    if (data.type === 'slice') {
  // 初期状態を小さく設定
    data.element.attr({
    style: 'transform: scale(0); transform-origin: center;'
  });

  // スケールアニメーション
  setTimeout(function() {
    data.element.attr({
      style: 'transform: scale(1); transform-origin: center; transition: transform 0.8s ease-out;'
    });
  }, data.index * 200);
  }
  });
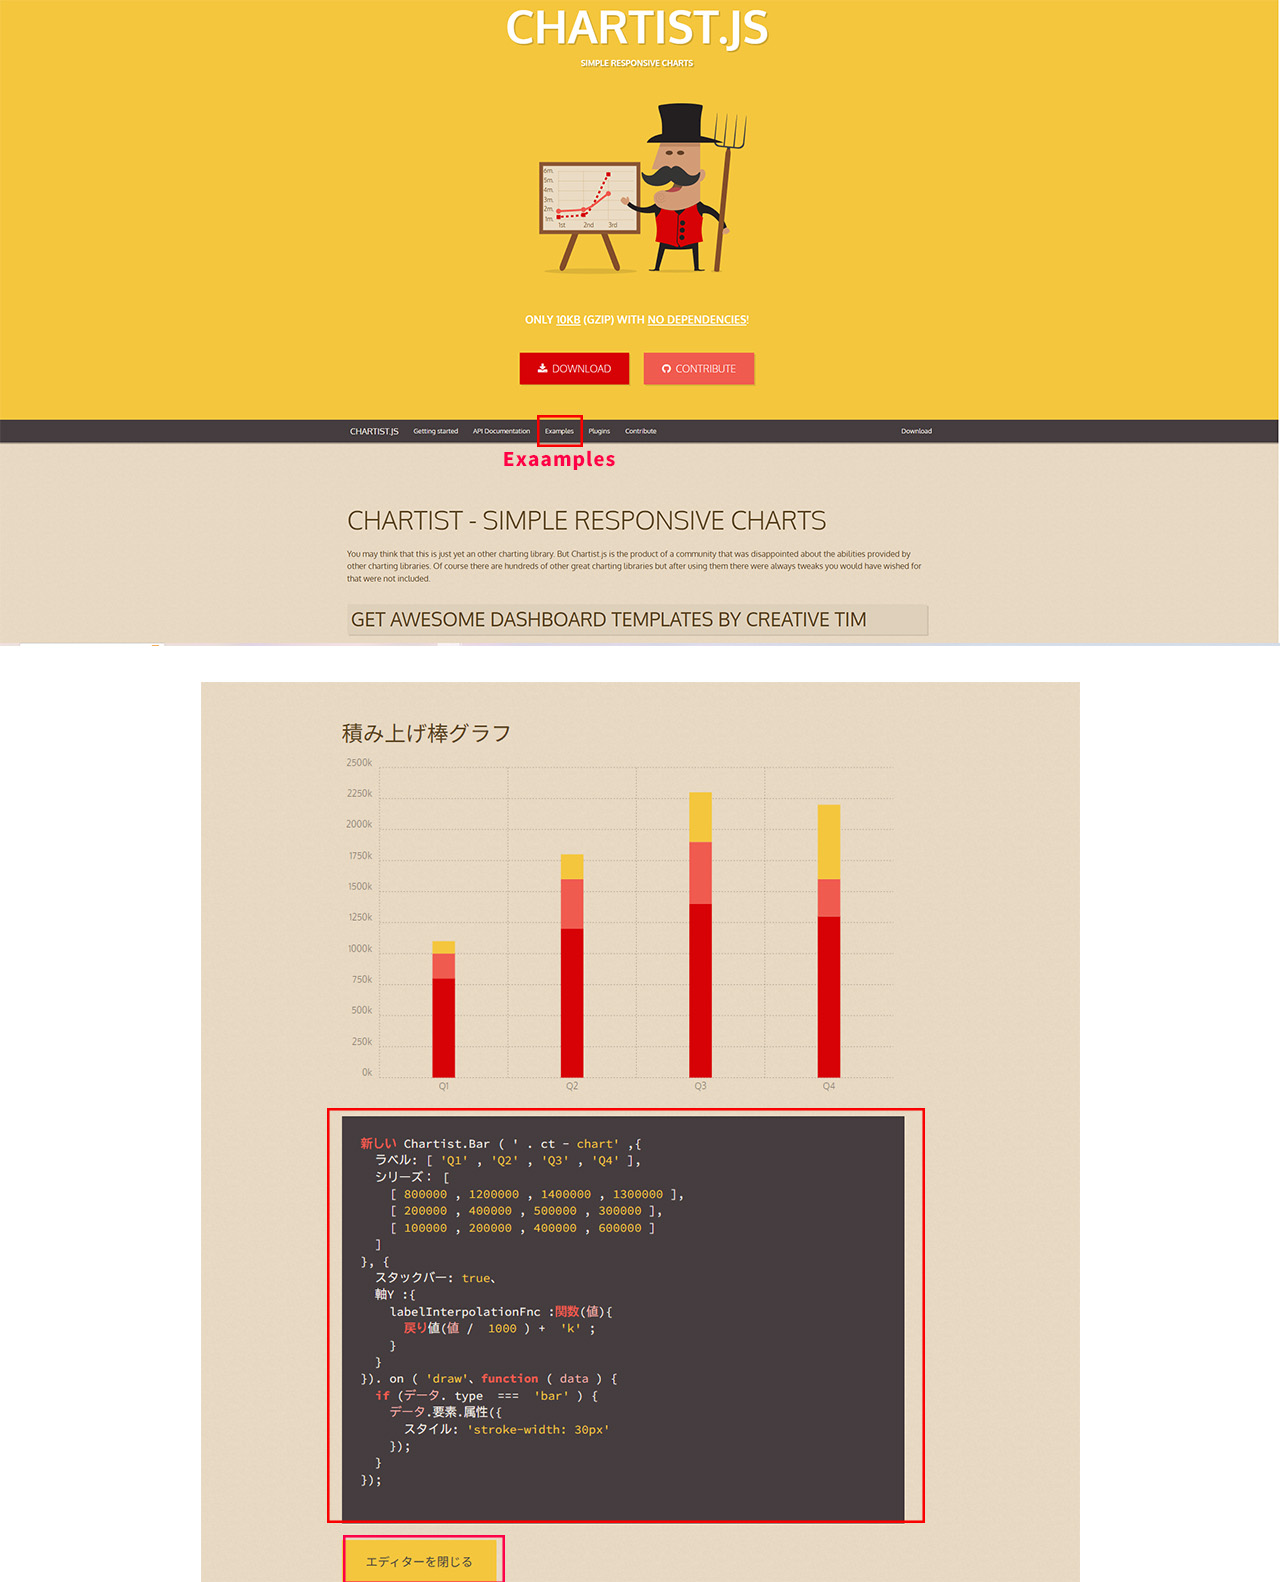
棒グラフ
  HTML
  <div class="chart-test"></div>

  JavaScript
  new Chartist.Bar('.chart-lod', {
  labels: ['Q1', 'Q2', 'Q3', 'Q4'],
  series: [
    [800000, 1200000, 1400000, 1300000],
    [200000, 400000, 500000, 300000],
    [100000, 200000, 400000, 600000]
  ]
  }, {
    stackBars: true,
    axisY: {
      labelInterpolationFnc: function(value) {
        return (value / 1000) + 'k';
      }
    }
  }).on('draw', function(data) {
    if(data.type === 'bar') {
      data.element.attr({
        style: 'stroke-width: 50px'
      });
    }
  });

  CSS
  /* Chartist.js 棒グラフ */
  .chart-lod {
    width: 100%; /* 幅を100%に設定 */
    height: auto; /* 高さは自動調整 */
    margin: 0 auto; /* 中央寄せ */
  }
  /* 棒グラフ専用のラベル */
  .ct-chart-bar .ct-label {
    font-size: 10px;
    text-anchor: middle; /* ラベルを中央に配置 */
    font-weight: bold; /* ラベルを太字に */
    color: tomato;
  }
棒グラフ応用
  HTML
  <div class="chart-lod-custom"></div>

  JavaScript
  Chartist.js 棒グラフ応用//グラフの項目とデータ(棒グラフの場合)
  数値が[[]](2重カッコ)なので注意する
  var barData = {
    labels: ['10代','20代','30代','40代','50代'],
  設定した人数分だけ枠が増える
    series: [[36,27,16,13,49]]
  };
  表示オプション(グラフの高さや幅)
  var barOptions = {
    Y軸の意味
    axisY: {
      グラフを描画するボックスの左端からデータ項目を表示するスペース
      offset: 100,
      グラフ罫線の間隔(px)
      scaleMinSpace: 30,
      メモリの項目(今回は人)
      labelInterpolationFnc: function(value) {
      return value + '人'
      }
    },
    width: '100%',
    height: '500px'
  };
  グラフの種類と表示させる場所
  new Chartist.Bar('.chart-lod-custom',barData,barOptions)

  CSS
  .chart-lod {
  width: 100%; /* 幅を100%に設定 */
  height: auto; /* 高さは自動調整 */
  margin: 0 auto; /* 中央寄せ */
  }
  棒グラフ専用のラベル
  .ct-chart-bar .ct-label {
    font-size: 10px;
    text-anchor: middle; /* ラベルを中央に配置 */
    font-weight: bold; /* ラベルを太字に */
    color: tomato;
  }
  棒グラフ1個目のバーの色
  .ct-series-a .ct-bar{
    stroke: gray;
  }
  テキストの変更
  .ct-bar {
    stroke-width: 15%;
  }